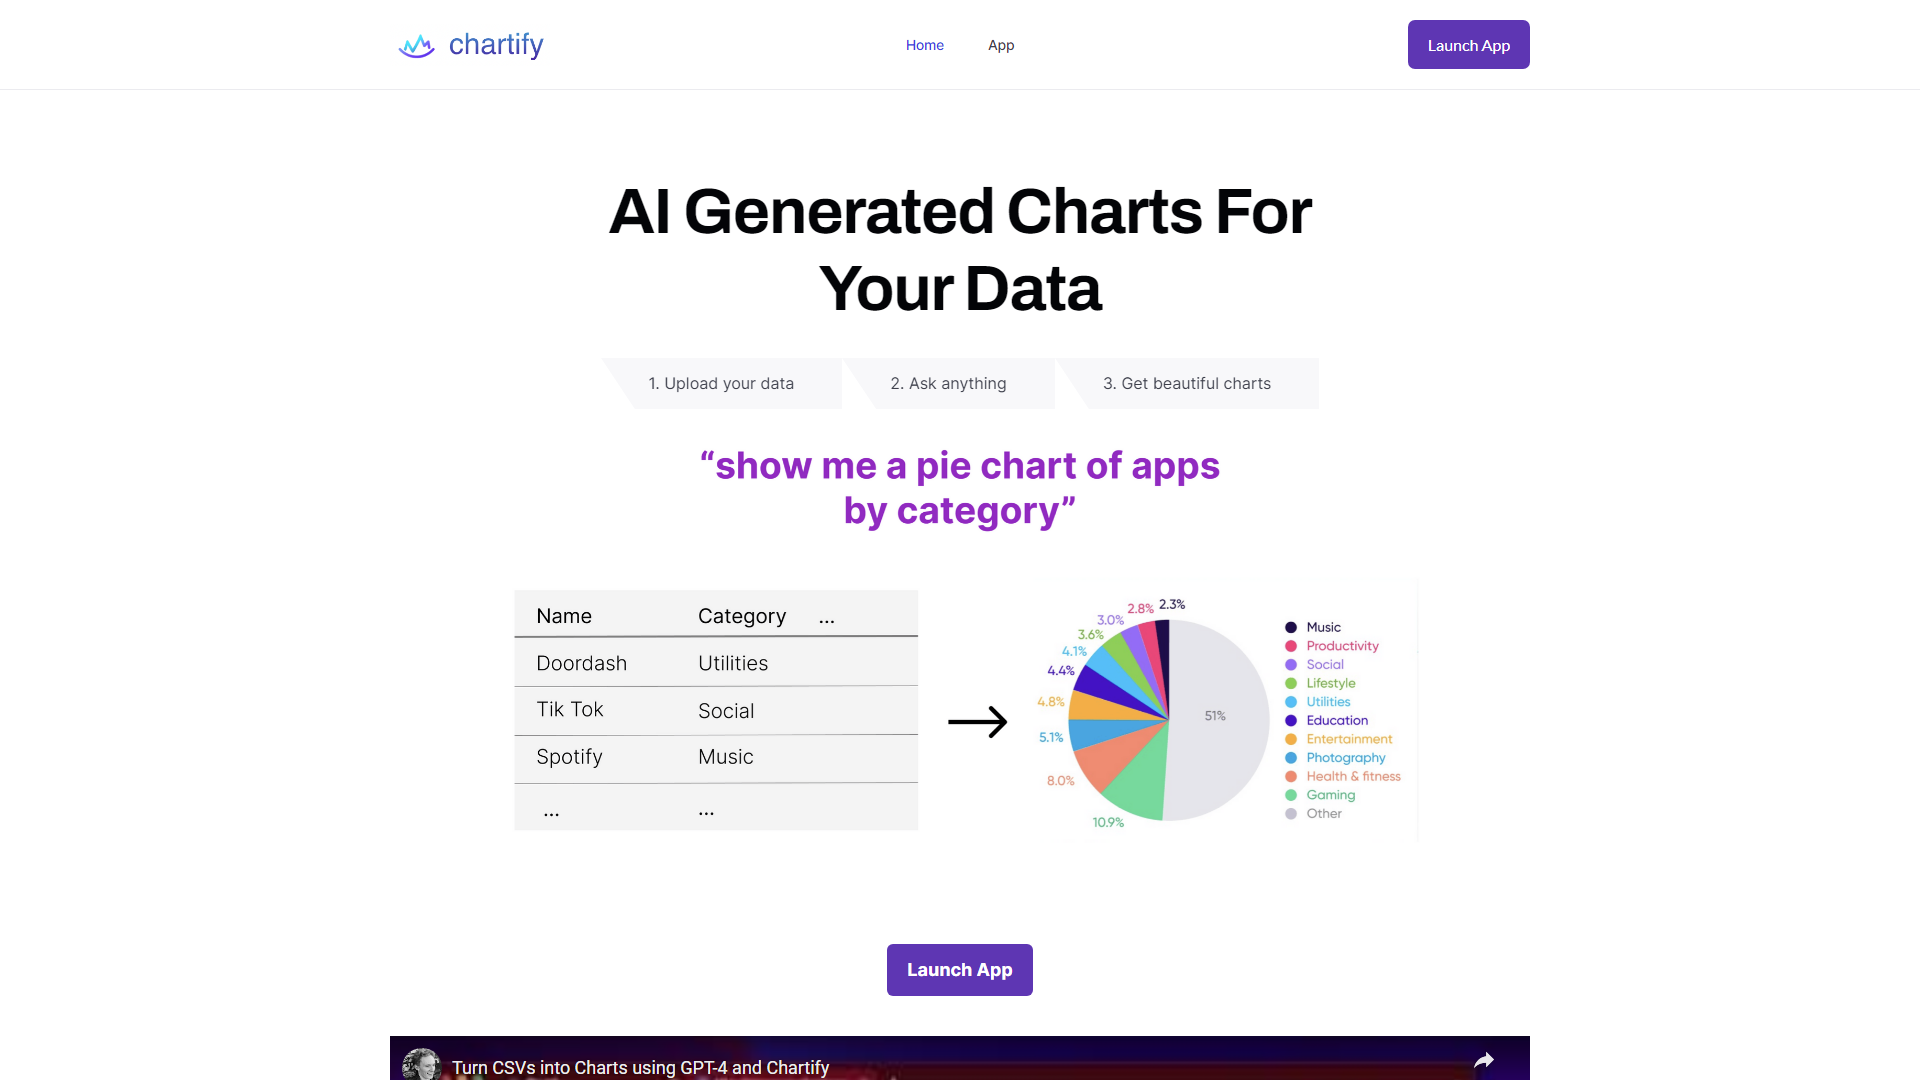
Chartify is a revolutionary platform that leverages the power of artificial intelligence to transform raw data into visually appealing charts and graphs. It is designed to convert CSV files and database tables into rich, interactive visualizations, making it easier for users to understand and interpret complex data. The website offers a wide range of chart types, from pie charts to line graphs and bar charts, catering to various data visualization needs.
One of the unique features of Chartify is its AI-powered suggestion system. This system recommends new and innovative ways to visualize data, helping users discover chart types they may not have considered before. This feature is particularly useful for users who are unsure about the best way to represent their data, as it provides them with creative and effective visualization options.
Chartify is not just a tool for data visualization, but also a platform for data communication. As one of its users, Amy X Lu, a PhD student at UC Berkeley, puts it, Chartify is a powerful new way to talk to data. This suggests that the platform can help users communicate their findings more effectively, making it a valuable tool for researchers, analysts, and anyone who works with data.
In summary, Chartify is a comprehensive data visualization platform that uses AI to generate charts from CSV files and database tables. Its unique suggestion system and wide range of chart types make it a versatile tool for data visualization and communication. Whether you're a researcher looking to present your findings in a visually appealing way, or a business analyst trying to make sense of complex data, Chartify can help you achieve your goals.
